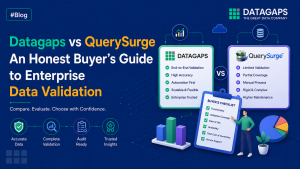
Datagaps vs iCEDQ: An Overview
Datagaps vs iCEDQ: Both platforms automate data validation at full volume, but iCEDQ stops at the data behind reports. Datagaps DataOps Suite also scores data quality, generates synthetic test data, and tests BI dashboards as users see them. It is named in two Gartner Market Guides.
The Verdict at a Glance
Both reconcile source and target at full volume; Datagaps carries validation into data quality and BI.
Across BI reports, Datagaps tests reports as users see them: visuals, filters, security, load and pixel-level regression.
Datagaps turns data quality into a score with drill-down; iCEDQ runs quality rules without a scorecard.
Datagaps generates complete validation workflows, for data and for BI, across hundreds of tables and reports at once.
Datagaps is named in the Gartner Market Guides for DataOps Tools and Data Observability Tools, with more recent reviews.
This guide compares Datagaps DataOps Suite and iCEDQ for teams choosing a platform for data validation, data quality, and BI testing. It starts with how the category is changing and what analysts now expect from it. It then compares the two platforms feature by feature, checks iCEDQ’s own claims, and closes with three questions to take into any evaluation.
What Is Changing in How Enterprises Validate Data?
Data validation started with one question: did the target receive what the source sent? Enterprises still ask it. Four shifts have widened what they expect a platform to do beyond that.
Validation is moving to the dashboard
The dashboard is where the business acts on data, and it is the least tested layer. Power BI and Microsoft Fabric have no native testing feature, as SQLBI has pointed out. Of 95 enterprise data teams Datagaps worked with, 73% needed BI report validation alongside ETL reconciliation.
Buyers want fewer tools
Gartner's 2026 Market Guide for Data Observability Tools describes a market moving toward unified platforms that combine observability, quality, and governance. Buyers put it in their own terms: test cases sit in one tool, runs in another, and tracking in a third. They want one platform instead.
AI is taking on whole tasks
Gartner's 2026 research on augmented data quality points to agentic automation across the quality lifecycle. Buyers now ask how much of the validation work agents can generate, run, and explain, with a person approving each change.
Migrations put every layer under test at once
A move to Snowflake, Databricks, or Fabric changes pipelines, data quality, and reports in one go, turning hundreds of tables and reports into hundreds of tests. Forty percent of the teams Datagaps worked with needed migration validation, yet 65% were still validating data by hand.
These four shifts are the yardstick for the comparison that follows.
What Should a Data Validation and Data Quality Platform Cover Today?
Analyst definitions have caught up with these shifts. Gartner’s DataOps Tools research defines test automation as business-rule validation, test-script management, regression testing, and test data management. Test data sits inside the definition, not beside it.
On data quality, Gartner’s Augmented Data Quality research expects profiling, rule management, rules written from plain language, and a metrics view built on critical data elements, used by business and BI teams as well as engineers. Gartner expects 70% of organizations to adopt modern data quality solutions by 2027 (Gartner, cited by Informatica, 2025).
Put the two together with the shift toward the dashboard and the requirement becomes four jobs. A platform has to reconcile pipelines, measure quality, supply safe test data, and validate what the business sees. Datagaps DataOps Suite is built around exactly those four jobs, one component for each, with AI agents working across all of them.
| The job | What the market expects | DataOps Suite component |
|---|---|---|
| Reconcile pipelines | Full-volume source-to-target and transformation testing, regression packs, CI/CD | ETL Validator |
| Measure quality | Profiling, business rules, quality scores by dimension, anomaly detection | Data Quality Monitor |
| Supply test data | Privacy-safe synthetic data that behaves like production | Test Data Manager |
| Validate the dashboard | Report data, visuals, filters, performance, and BI governance | BI Validator |
| Automate across all four | Agentic AI that generates, runs, and explains tests, with human approval | AI/ML agents and MCP server |
The components share one connector layer and one audit trail, so a single validation flow can start at a source table, apply data quality rules along the way, and end at a dashboard visual. Before comparing features, it is worth seeing how independent analysts have assessed that scope.
What this means for buyers: check all four jobs, not only the first. A platform that misses one leaves manual work where errors cost the most.
What Does Analyst Recognition Tell Buyers?
Gartner publishes two Market Guides that map directly onto this evaluation. Each defines a market, sets out the capabilities buyers should expect, and names Representative Vendors based on analyst assessment of market presence and functional coverage. Vendors cannot nominate themselves, so a listing is an outside view of what a product actually does.
The Market Guide for DataOps Tools covers pipeline orchestration, observability, environment management, deployment automation, and test automation. The Market Guide for Data Observability Tools covers how platforms monitor data content, pipelines, and infrastructure. One is about testing data as it moves; the other is about watching its quality continuously.
| Independent signal | Datagaps | iCEDQ |
|---|---|---|
| Gartner Market Guide for DataOps Tools (Oct 2025) | ✓ Representative Vendor, categorised as a specialist in data pipeline test automation | Cites a DataOps guide mention on its own site; edition not named |
| Gartner Market Guide for Data Observability Tools (Feb 2026) | ✓ Representative Vendor for Data Quality Monitor: data content observability, pipeline observability, and lineage | No listing found in public sources |
| Gartner Peer Insights | 4.6 from 8 ratings; newest June 2026 | 4.0 from 1 rating; April 2024 |
In the DataOps guide, Gartner points to enterprise deployments of Datagaps in financial services, healthcare, technology, and higher education. In the Data Observability guide, Data Quality Monitor is recognised for validating data where it resides rather than moving it.
Being named in both matters because they are separate markets with separate criteria. Analysts recognised Datagaps both for testing pipelines and for monitoring data quality continuously, which is the same scope buyers now expect from one platform. Check the current vendor lists yourself: recognition is the one claim no vendor should ask you to accept on trust.
How Do Datagaps and iCEDQ Compare Feature by Feature?
This is where iCEDQ is measured against the four jobs. Rows marked Neutral are areas where both platforms deliver; the rest show where they part ways.
| Capability | Datagaps | iCEDQ | Advantage |
|---|---|---|---|
| Source-to-target reconciliation | 100% of records on a Spark engine | 100% of records; in-memory engine plus Spark | Neutral |
| Many sources and transformations in one test | One visual dataflow chains sources, transformations, comparisons and actions; SQL, Python, Scala | Rule-based comparisons, including multi-source; Groovy or Java for complex logic | Datagaps |
| Bulk test generation | Hundreds of complete dataflows and BI tests at once | Rules created in bulk or by AI from mapping documents; no bulk BI tests | Datagaps |
| BI report data validation | Report vs database, report vs report | Report data via BI APIs, including Power BI semantic models | Neutral |
| BI visual regression | Pixel-to-pixel and textual comparison; side-by-side PDFs | None; bypasses the visual layer | Datagaps |
| BI functional testing | Filters, slicers, parameters, bookmarks, row-level security | Filters and parameters applied to extract data | Datagaps |
| BI performance and stress testing | Concurrent-user load testing | None | Datagaps |
| BI governance | Finds unused measures, duplicate reports and orphaned tables; compares KPIs across platforms | None | Datagaps |
| Data quality rules and monitoring | Rules, profiling, monitoring | Rules, profiling, monitoring | Neutral |
| Data quality scoring | Scores by dimension; scorecard with drill-down to column | No quality score or scorecard; a few pre-packaged dashboards | Datagaps |
| Observability | ML anomaly detection, profiling, lineage | ML and rule-based anomaly detection, auto-profiling | Neutral |
| Test data management | Synthetic data; PII and PHI masking | None | Datagaps |
| AI and agents | AI agents across ETL, data quality, BI and test data, plus an MCP server | AI rule generation and an MCP server for data rules, workflows and profiling | Datagaps |
| CI/CD and deployment | REST API, CLI, Azure DevOps, Jenkins; on-premises or your cloud, on Kubernetes, Databricks or EMR | REST API, CLI, Jenkins, Azure Pipelines; SaaS on AWS or on-premises | Neutral |
iCEDQ entries reflect its public product documentation as of October 2026.
How Do iCEDQ's Public Claims Hold Up?
iCEDQ markets itself as the only integrated platform for data testing, monitoring, and observability, covering the entire data development lifecycle. We checked its main claims against its own documentation and independent reviews.
| # | iCEDQ claim | What the evidence shows | Verdict |
|---|---|---|---|
| 1 | The only integrated testing, monitoring and observability platform | One rule engine runs from QA into production, so the integration is real. It is not the only one: Datagaps DataOps Suite also combines testing, monitoring and observability, and adds test data management and dashboard testing. | Integrated, not complete |
| 2 | Covers the entire data lifecycle | It spans development, QA and production, but coverage ends at report data. iCEDQ’s own BI page says it works from the data behind reports, not what the dashboard displays. | Overstated |
| 3 | BI and report testing | Validates report numbers across major BI tools, including Power BI semantic models. No visual or load testing. | Data only |
| 4 | Full-volume validation, no sampling | True. Datagaps validates 100% of records as well. | True, not unique |
| 5 | Data reliability | Writes at length about data quality dimensions. Its product offers rules and observability metrics, but no data quality scorecard. | No quality scorecard |
iCEDQ’s claims hold at the data layer. Its “only” and “entire lifecycle” claims break where the business looks: the dashboard.
Where Does Datagaps Go Further Than iCEDQ?
Seven capabilities separate the two platforms. None of them can be switched on with a configuration change.
1. Pixel-to-Pixel Visual Regression
A report can hold correct data and still be wrong: a series disappears after an upgrade, a label truncates, a chart reorders. BI Validator compares report renders pixel by pixel and as text across versions and environments, and produces side-by-side PDFs for sign-off. iCEDQ pulls report data through APIs and skips the visual layer, so these defects go to manual review.
2. Functional and Load Testing of Dashboards
BI Validator applies filters, slicers, parameters, and bookmarks, tests row-level security, and simulates concurrent users to measure load times and find bottlenecks before rollout. iCEDQ has no functional or load testing for dashboards.
See how BI Validator load-tests a dashboard before rollout →
3. Hundreds of Workflows Generated at Once
Datagaps wizards generate tests for hundreds of tables at once and cut configuration time by up to 70%. Mapping Manager turns a mapping document into a test suite, and Generate DB Flows builds one from schema metadata. Each output is a complete dataflow with sources, transformations, comparisons, and actions, and BI Validator does the same for report regression. iCEDQ generates rules, in bulk or with AI; it does not generate BI tests.
4. Many Sources and Real Logic in One Test
One Datagaps dataflow can join S3 files, Oracle, Snowflake, and an API, transform the result in SQL, Python, or Scala, and reconcile it against a target on a drag-and-drop canvas. Mismatch insights point to the root cause. iCEDQ builds tests as rules, and complex logic goes into Groovy or Java, a learning curve its own reviewers mention.
5. Data Quality You Can Measure
Data Quality Monitor scores data at rest and in motion for accuracy, consistency, completeness, unicity, and conformity. Scores roll up into an enterprise scorecard with drill-down to column level. Alerts fire on threshold breaches, and failures can open Jira or ServiceNow tickets. iCEDQ writes about quality dimensions at length but gives users no scorecard to measure them.
6. Test Data Management
Gartner's definition of DataOps test automation includes test data management. Test Data Manager generates synthetic data that keeps production patterns and relationships, masks PII and PHI for GDPR and HIPAA, and produces millions of rows in minutes. iCEDQ has no test data capability.
7. AI Across the Whole Stack
Both vendors offer an MCP server; iCEDQ's is built around rules, workflows and profiling. Datagaps has 15 AI and ML capabilities, its MCP server among them, spanning ETL, data quality, BI, and test data. Agents write tests from mapping documents, recommend DQ rules, build BI tests from plain English, compare KPIs and visuals across BI platforms, convert DAX to SQL, and flag unused measures and duplicate reports. Every change waits for human approval.
Where Do Testing, Data Quality, and BI Validation Come Together?
These differences matter most when they appear together, and a migration is where they do. A move to Snowflake, Databricks, or Fabric, one of the four shifts described earlier, puts pipelines, data quality, and dashboards under test at once.
A migration is complete only when the data has moved, its quality holds on the new platform, and the reports still show the same numbers. iCEDQ covers the data and its rules. Datagaps covers all three from one platform: tests generated in bulk for the move, quality reconciled across systems and scored on the target, and reports compared down to the visual, with DAX-to-SQL validation for BI migrations.
What Do Teams Moving Off iCEDQ Report?
The same issues come up across recent evaluations with iCEDQ users. These are anonymized patterns, set against what Datagaps provides.
| What teams report | What Datagaps provides |
|---|---|
| Hundreds of long, complex SQL rules that are hard to read and maintain | Visual dataflows, generated in bulk from mapping documents or schema metadata |
| Failure alerts without detail, so teams build their own dashboards on exported error records | Built-in DQ dashboards, row-level exception outputs, and Jira or ServiceNow tickets with context |
| Test lifecycle in one tool, execution in iCEDQ, tracking in a third | One platform for test case lifecycle and execution, connected to Jira and Azure Test Plans |
| Long runs, and detail lost when logic is pushed into the warehouse | Spark horizontal scaling; row-level mismatch output under pushdown |
| Comparison insights that make root cause easier to find | Comparison insights and AI-guided root-cause analysis |
What Do Independent Reviews Say?
On the two platforms where both vendors are reviewed, Datagaps has the more recent feedback. As of October 2026, Datagaps has ten G2 reviews, the newest from August 2026, and a 4.6 rating from eight Gartner Peer Insights reviewers, the newest from June 2026. iCEDQ’s newest G2 review is from August 2024, and it has a single Gartner Peer Insights rating, from April 2024.
Datagaps reviewers point to the BI layer. One G2 reviewer uses BI Validator for Tableau regression and stress testing, which Tableau does not offer natively, and a Gartner reviewer notes that it catches changes in both data and visuals. A recent industry guide also highlights Datagaps for multi-source migration QA (Testriq, 2026).
Is Your Data Tested, Measured, and Governed, from Source to Screen?
Choosing a platform now means answering three questions, not one. Each comes with signs that a team has outgrown data-level validation.
| Question | Signs you need it | How Datagaps answers it |
|---|---|---|
| 1. Is the data right? (Test it) |
Hundreds of rules that are hard to maintain; migrations of hundreds of tables; test data copied from production | Full-volume reconciliation; complete dataflows generated in bulk; many sources in one visual test; synthetic test data generation with masking of sensitive fields |
| 2. How good is the data? (Measure it) |
Leadership asks for a data quality number and nobody has one; alerts arrive without context | Quality scores by dimension; enterprise scorecard down to column level; ML anomaly detection; tickets with context |
| 3. Can the business trust what it sees? (Govern it) |
Dashboards checked by eye after every release; duplicate reports and measures piling up; a BI migration under way | Pixel-to-pixel regression; performance and security validation; KPI, visual, filter and metadata comparison; unused measures, duplicate reports and orphaned tables found; DAX-to-SQL validation |
Pipeline reconciliation answers the first question, and both platforms handle it. A quality score answers the second. Governing every visual, filter, permission, and KPI answers the third. Datagaps DataOps Suite answers all three, from source to screen, in one platform.
Check it on your own data. Teams on iCEDQ can run both platforms side by side during a 14-day trial, extendable by 14 days, and generate dataflows in bulk from existing mapping documents instead of rebuilding rules one by one.
See Datagaps validate a iCEDQ-style workload end-to-end on your data
Our team will run a live demo against your specific use case — your stack, your data problem, your pipeline.
SOC 2 Type II certified | ISO 27001 certified | No credit card required for trial | Your data never leaves your environment
Frequently Asked Questions
Is Datagaps an alternative to iCEDQ?
Yes. Datagaps DataOps Suite covers what iCEDQ does, including full-volume source-to-target reconciliation, data quality rules, monitoring, and anomaly detection. It adds pixel-to-pixel BI regression, dashboard load testing, data quality scoring, BI governance, and synthetic test data. Teams evaluating iCEDQ usually shortlist Datagaps when validation has to reach the dashboard.
What is the main difference between Datagaps and iCEDQ?
Scope. Both validate data pipelines at full volume, but iCEDQ stops at the data behind reports. Datagaps also tests what users see, including visuals, filters, row-level security, and performance under load. It scores data quality, governs the BI layer, and generates synthetic test data, all in one platform.
Can iCEDQ run visual regression tests on Power BI or Tableau dashboards?
No. iCEDQ validates report data through BI platform APIs, including Power BI semantic models, and bypasses the visual layer. Datagaps BI Validator compares report renders pixel by pixel and as text across versions and environments for Power BI, Tableau, Oracle Analytics, and other platforms, with side-by-side regression PDFs.
Which platform scores data quality, Datagaps or iCEDQ?
Datagaps. Data Quality Monitor scores data for accuracy, consistency, completeness, unicity, and conformity, rolls the scores into an enterprise scorecard with drill-down to column level, and alerts when thresholds are breached. iCEDQ runs data quality rules and writes about quality dimensions, but has no scorecard to measure them.
Can Datagaps generate tests for hundreds of tables at once?
Yes. Datagaps wizards generate tests for hundreds of tables at once. One customer created comparison tests for 400 SQL Server tables of more than 500 million rows each in a few hours. Mapping Manager turns mapping documents into test suites, and BI Validator creates report regression tests in bulk.
Can a team move from iCEDQ without rebuilding every test by hand?
Yes. Teams can run Datagaps alongside iCEDQ on the same pipelines during a 14-day trial, extendable by 14 days, and compare results. Instead of recreating rules one at a time, Datagaps generates dataflows in bulk from mapping documents or schema metadata, and connects to existing schedulers through its REST API and CLI.

Raj Mohan Achanta
Associate Product Manager, Datagaps
Associate Product Manager at Datagaps. Shapes the product experience across ETL Validator, BI Validator, and Data Quality Monitor.

Avinash Keshri
Head, Product Marketing
Head of Product Marketing at Datagaps and IIM Bangalore alumnus. 13+ years of experience in commercializing AI and data platforms across global markets.