

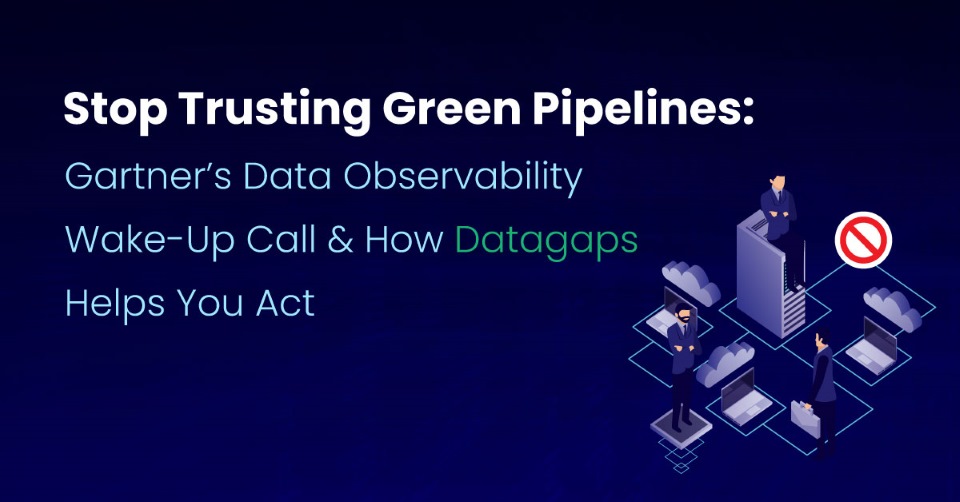
A pipeline can “succeed” while a business dashboard quietly drifts into nonsense — job status isn’t data trust. Drawing on Gartner’s 2026 Market Guide for Data Observability Tools, this post argues observability means five things: continuously watching data workflows, detecting issues early, alerting the right people, enabling fast troubleshooting, and supporting operations with context. It frames reliability across five lenses (data content, flow, infrastructure, usage, cost) and outlines a five-step pilot blueprint for adopting observability without ripping out existing monitoring.
Key Takeaways
- Data failures are often silent, unlike traditional job failures — a schema changes, a join breaks, or a distribution shifts without triggering any alert, so event-based monitoring alone misses them.
- Observability spans five lenses, not just pipeline status — data content, data flow/pipeline, infrastructure/compute, user usage, and financial allocation together define true data health.
- Two forces are shaping the buying market — AI augmentation (dynamic thresholds, faster root-cause analysis, automated remediation) and unified platforms that reduce tool sprawl across monitoring, governance, and security.
- A high-value pilot follows five concrete steps — pick one high-impact data product, define trust signals, implement validation from ingestion through BI consumption, operationalize outcomes with ownership and alerts, and measure business results like fewer incidents.
If you’ve ever had a pipeline “succeed” while the business dashboard quietly drifted into nonsense, you already know the uncomfortable truth: job status isn’t data trust.
Modern data stacks are bigger, faster, and more distributed than ever – cloud warehouses, streaming ingestion, ELT frameworks, data products, and now AI systems that amplify the impact of bad data. In this reality, we believe the old approach (reactive monitoring + a handful of checks + lots of tribal knowledge) can’t keep up.
If you want a solid overview of the data observability category and what buyers look for, the best Gartner® report - Market Guide for Data Observability Tools is a useful place to start.
Our perspective: observability is “data health”, not just monitoring
Traditional monitoring tends to be event-based: a job fails, a system goes down, an alert fires. The challenge is that data failures are often silent – a schema changes, a join breaks, a distribution shifts, a transformation logic regresses, or a dashboard filter starts behaving differently.
We think data observability should do five jobs well: continuously watch data workflows, detect issues early, alert the right people, help teams troubleshoot quickly, and support day-to-day operations with context (lineage, collaboration, incident workflows, and cost visibility). Our takeaway is simple: if data drives decisions, then data reliability has to be engineered like uptime.
The five lenses you need to see reliability end-to-end
We like to think of observability as five lenses that work together:
1. Data content – Is the data accurate, complete, consistent, and within expected bounds?
2. Data flow & pipeline – Is data moving correctly through ingestion, transformation, orchestration, and delivery?
3. Infrastructure & compute – Are resources sufficient, stable, and performant?
4. User usage & utilization – Who is using data, how, and what changed?
5. Financial allocation – What is this pipeline/data product costing, and who owns that spend?
This is the shift teams are making: from “Is the job green?” to “Is the data healthy, used, and worth what it costs?”
We see two big directions shaping buying decisions:
AI augmentation
Expect tools to become better at dynamic thresholds, anomaly prediction, faster root-cause analysis, and even automated remediation actions. In plain terms: fewer false alarms, earlier detection, and less time spent guessing.
Unified platforms
Organizations are increasingly looking for consolidated experiences that reduce tool sprawl. Instead of stitching together monitoring, governance, and security across multiple products, the market is moving toward more unified “single pane” operations.
For buyers, this means your “observability strategy” shouldn’t be another standalone tool – it should be part of how you run DataOps.
How Datagaps aligns with Gartner’s observability roadmap
Datagaps is built for the outcomes Gartner emphasizes – trusted data across the lifecycle, operationalized with repeatability and evidence.
| Lens | Key Question |
|---|---|
| Data Content | Is the data accurate, complete, consistent, and within expected quality thresholds? |
| Data Flow & Pipeline | Is data moving correctly through ingestion, transformation, orchestration, and delivery processes? |
| Infrastructure & Compute | Are compute resources sufficient, reliable, stable, and performing as expected? |
| User Usage & Utilization | Who is using the data, how is it being used, and what usage patterns have changed? |
| Financial Allocation | What are the costs associated with this data pipeline or product, and who is accountable for that spend? |
How to use the report: A simple pilot blueprint that works
Our advice is practical: don’t rip and replace. Start where today’s monitoring fails, then pilot observability where the business impact is real. A high-value pilot looks like this:
- Pick one high-impact data product (revenue dashboard, regulatory pipeline, AI feature dataset).
- Define trust signals (freshness, reconciliation, drift thresholds, KPI integrity).
- Implement validations across ingestion → transformations → consumption (including BI).
- Operationalize outcomes (ownership, alerts, run history, incident workflow).
- Measure business results: fewer incidents, faster root cause analysis, and fewer post-release surprises.
That’s exactly the kind of real-world adoption path Datagaps is designed to support.
Ready to make data trust measurable?
Download the Gartner Market Guide and learn more.
Book a Datagaps walkthrough to see end-to-end validation (pipeline + dashboard) on real scenarios.
Request a pilot plan and we’ll help you identify the highest-impact gap to prove ROI fast.
If “trusted data” is a priority, now’s the time to move from monitoring jobs to managing data health.
Conclusion
The core shift Gartner is pointing to isn’t a new tool category — it’s a new question. “Is the job green?” only confirms a process ran; it says nothing about whether the data itself is accurate, complete, or trustworthy by the time it reaches a dashboard. Observability across all five lenses — content, flow, infrastructure, usage, and cost — is what closes that gap, and doing it well increasingly means fewer disconnected tools, not more. Teams don’t need to rip out existing monitoring to get there; a single high-impact pilot, with clear trust signals and measurable outcomes, is often enough to prove the value before scaling further.
Source: Gartner Report, Market Guide for Data Observability Tools, By Melody Chien and Michael Simone, February 2026.
Gartner is a trademark of Gartner, Inc. and/or its affiliates.
Frequently Asked Questions: Data Observability
1) Why isn’t a “successful” pipeline run enough to trust the data?
Pipeline success only confirms the job ran — it doesn’t catch silent failures like schema changes, broken joins, distribution shifts, or transformation logic regressions that leave the report technically complete but factually wrong.
2) What are the five lenses of data observability?
Data content (accuracy/completeness), data flow and pipeline health, infrastructure and compute, user usage and utilization, and financial allocation — together these define whether data is healthy, used, and worth what it costs.
3) How is the data observability market evolving?
Two trends are shaping it: AI augmentation (dynamic thresholds, anomaly prediction, automated remediation) and a shift toward unified platforms that consolidate monitoring, governance, and security instead of stitching together separate tools.
4) How should a team start piloting data observability?
Start with one high-impact data product, define trust signals like freshness and reconciliation thresholds, implement validation from ingestion through BI consumption, operationalize ownership and alerting, and measure results through fewer incidents and faster root-cause analysis.

Anand Rao Vala
VP Marketing, Datagaps
VP of Marketing at Datagaps. Go-to-market leader for enterprise data and analytics, with prior roles at Qlik, Informatica, IBM, and Hitachi Vantara.