Join Us at Trusted Data Summit themed on "Trusted Data-AI Ready Outcome" on Nov 19th 2026 at 09:30 EST

DataOps Suite
The complete platform
Platform Overview
See how it works

DataOps Suite

Data Quality and Agentic AI platform that validates, reconciles, scores, monitors and remediates data from ingestion to BI and AI.

Why one platform

Agentic AI-powered test and rule creation
Agents generate data quality rules, validation tests and SQL from prompts, with your approval.
Data quality score per dataset
Shows the current score, what changed since the last run and the failing records behind it.
Validation and observability inside the pipeline
Every load is compared with its source, transformations are tested against business logic, and freshness, volume and schema changes are monitored.
Reports that match the source
Dashboard figures are compared with the source data behind them before users see them.
Test data without real records
Synthetic data that mirrors production replaces sensitive records in test environments.
Quality gates for releases
Pipeline and report changes are tested before they go to production.

DataOps Data Quality

Continuously profiles, validates and scores enterprise data, with Agentic AI that recommends rules and flags anomalies, so analytics and AI run on trusted data.

Capabilities

AI-recommended DQ rules and scoring
Agents suggest completeness, validity and uniqueness rules, with scores down to the column.
Data profiling
Analyzes distributions, patterns and frequencies to surface outliers.
AI-based observability
Agents monitor pipelines end to end, detect anomalies and suggest fixes.
Data catalog
Organizes models and tables in one catalog, with AI-drafted descriptions.
Data lineage
Traces data from origin to destination through every transformation.
Data quality issue tracking
Assigns every failing record to an owner and tracks it to resolution.

ETL Validator

Automates ETL/ELT testing, with Agentic AI that builds tests from mapping docs, confirming every record arrives complete, accurate and correctly transformed.

Capabilities

AI-generated ETL tests
Turns mapping docs into checks for joins, transforms and edge cases.
Source-to-target validation
Matches loaded data to the source, down to record counts and required fields.
Transformation validation
Verifies business logic with SQL, Python or Scala.
Migration validation
Checks schema, row counts and integrity for cloud migrations.
Metadata change audit
Catches schema and metadata discrepancies before they break pipelines.
Root cause and adaptive tests
Pinpoints where data broke, and agents update tests when mappings change.

BI Validator

Automates testing and governance for Power BI, Tableau and Oracle Analytics, with Agentic AI that builds tests from plain English and keeps reports accurate and reliable.

Capabilities

AI-created BI tests
Describe a test scenario in plain English, and agents build it.
Visual-to-source comparison
Compares the data behind every visual to the source using auto-generated SQL.
Regression and upgrade checks
Pixel-level comparisons across environments, with AI summaries of what changed.
Measure logic checks
Converts BI measures and calculations to SQL to confirm KPI logic.
Performance and load testing
Simulates concurrent users and measures load and refresh times.
BI governance
Finds unused measures, duplicate reports and orphaned tables.

Test Data Manager

Uses Agentic AI to detect and mask sensitive data and generate synthetic data that mirrors production, so teams can test without exposing real records.

Capabilities

AI synthetic data generation
Learns patterns from a small sample to create production-like data.
PII discovery and masking
Detects PII and PHI and replaces it with realistic fake values.
Relationship-aware data
Keeps linked tables connected with referential integrity.
Millions of records in minutes
Scales for load, stress and performance testing.
Multi-format output
CSV, Parquet or JSON, or loaded straight into test databases.
Compliant by design
Cloud or on-prem, supporting GDPR and HIPAA requirements.
Data Quality Use Case
The problem to solve
ROI calculator
Estimate the time and cost you’ll save.
Financial services
SOX, BCBS 239 and NAIC MAR

Banking, Financial Services, and Insurance (BFSI)

Stop reporting errors before examiners find them, with every number traced from core system to board dashboard.

How Datagaps helps

Core platform migrations
Cut over banking and insurance platforms, including mainframe to cloud, without losing a record.
Regulatory reporting
Hold submissions until the data meets quality thresholds.
Financial reconciliation
Match GL to subledger automatically, with every break flagged.
Risk and credit data
Catch drift before risk, lending and pricing models degrade.
Dashboard attestation
Prove capital and board dashboards match the warehouse.

Healthcare

Keep claims and clinical data accurate through every migration, without exposing patient records in testing.

How Datagaps helps

EHR migrations
Confirm every record survives the move to Epic, Cerner or Oracle Health.
Claims data quality
Catch errors in claims and remittance feeds as they arrive.
APCD submissions
Check every file against state templates before you submit.
Clinical dashboards
Catch KPI and report changes after every refresh.
Provider directories
Keep provider listings accurate, current and audit-ready.

Life Sciences

Catch issues in clinical and real-world data before submission, and keep trial subject data out of test environments.

How Datagaps helps

Clinical data migrations
Move EDC, CTMS and LIMS data to the cloud without losses.
CRM migrations
Keep rebate calculations right through Veeva and Salesforce moves.
Pharmacovigilance data
Catch adverse event data issues before regulatory submission.
Commercial and clinical dashboards
Trace every KPI back to source clinical and lab records.
De-identified trial data
Keep subject data out of test, analytics and AI environments.

Manufacturing

Avoid broken ERP cutovers and supplier overpayments, and catch sensor drift before it hits production.

How Datagaps helps

ERP migrations
Move BOM, inventory and financial data across Oracle, SAP and cloud without breaks.
Supplier reconciliation
Catch overpayments and duplicate invoices with three-way PO, ASN and invoice matching.
Sensor data quality
Catch drift before it skews predictive maintenance and yield models.
Operations dashboards
Catch report breaks after every release or upgrade.
Safe ERP test data
Keep supplier pricing and production volumes out of lower environments.

Retail and Utilities

Catch settlement, inventory and pricing errors before your customers or regulators do.

How Datagaps helps

Settlement reconciliation
Match marketplace payout files to the general ledger, record by record.
Inventory accuracy
Keep POS, ERP and warehouse numbers in sync.
Pricing and promotions
Catch price and promotion mismatches across channels.
Reliability dashboards
Keep SAIDI and SAIFI reliability reporting accurate.
BI under load
Make sure reports hold up for thousands of concurrent users.

Higher Education & Research

Get enrollment, financial-aid and transcript data right before SIS cutover, before students feel it.

How Datagaps helps

SIS migrations
Validate moves from Banner or PeopleSoft to Workday Student or Ellucian.
Financial-aid reconciliation
Match aid and Bursar data to the general ledger.
Enrollment reporting
Keep census and admissions dashboards consistent from cycle to cycle.
Federal reporting
Monitor data quality ahead of IPEDS submissions.
Safe student data
Test and train AI without exposing real student records.

Trusted Data Summit

A practitioner summit focused on the validation, observability, governance, and reconciliation practices that determine whether enterprise data is ready for AI.

Save Your Spot
Nov 19th, 2026
Technology Partners
Cloud, data and BI platforms

Become a partner

Resell, implement or co-deliver

Technology Partners

Datagaps works natively with the cloud, data and BI platforms your teams already run.

Our technology partners

AWS logo
Cloudera logo
Tableau logo
Microsoft Azure logo
Snowflake logo
Oracle logo
Databricks logo

SI Partners

Consulting and integration firms that deliver Datagaps validation for enterprise clients worldwide.

Our SI partners

Solutions

Use cases

Cloud platforms

BI and analytics

BI Report Testing Across Multiple Sources: Find and Explain KPI Mismatches

BI Report Testing Across Multiple Sources - Find and Explain KPI Mismatches

BI report testing across multiple sources compares what a report shows with the sources behind it, with other reports and with other environments, then explains any difference. BI Validator automates this for Power BI, Tableau and Oracle Analytics. This guide shows how to find a KPI mismatch with BI Validator, explain it, and keep it from returning.

Key Takeaways

  • A KPI mismatch has one of five causes: definition, timing, scope, data quality or logic.
  • BI Validator compares report values with the source database under identical filters, and compares reports across platforms and environments.
  • Explain a mismatch by isolating the filter, visual or measure that differs.
  • Re run the same tests on a schedule and after every release, so mismatches do not return.

Why do KPI mismatches happen across multiple sources?

Every extra source adds another place for a number to drift. Four 2026 studies show where the pressure sits, and what each means for KPI testing:

  • BARC’s Data, BI and Analytics Trend Monitor 2026, a survey of 1,579 data professionals, ranks data quality management as the top trend. Teams now rank getting existing numbers right above adding new capabilities, which is the job of report testing.
  • Salesforce’s 2026 Connectivity Benchmark, which surveyed 1,050 IT leaders, found the average enterprise runs 957 applications and only 27% of them are integrated. Every application that is not integrated can compute, store and report its own version of a KPI.
  • dbt Labs’ 2026 State of Analytics Engineering report (363 respondents) found that integrating data from various sources fell as a top challenge, from 35% to 27%, while ambiguous data ownership stayed at 41%. Mismatches now come more often from unclear meaning and ownership than from broken pipelines, so tests must check definitions as well as data movement.
  • The 2026 Precisely and Drexel LeBow report, a survey of 505 data and analytics leaders, found that 71% of organizations with governance programs report high trust in their data, against 50% of those without. The link is a correlation, but it points to named owners and written definitions, which is where a KPI test starts.

What causes a KPI mismatch, and how does BI Validator test for it?

Cause What it looks like How BI Validator tests it
Definition Two reports calculate the same KPI differently Measure logic checks convert the BI measure to SQL, so the logic can be compared with the written definition
Timing The report and the source are read at different times Queries the BI platform and the source at the same time, under identical filter conditions
Scope Different filters or segments are included Applies filter combinations through the BI API and compares each result
Data quality The source holds duplicates or gaps Visual-to-source comparison exposes the difference, and source-side SQL shows the rows
Logic A join or calculation changes a total Compares the data behind every visual with auto-generated SQL on the source

Which four comparisons does BI Validator run?

Figure shows the four comparisons. Each answers a different question about the same number.
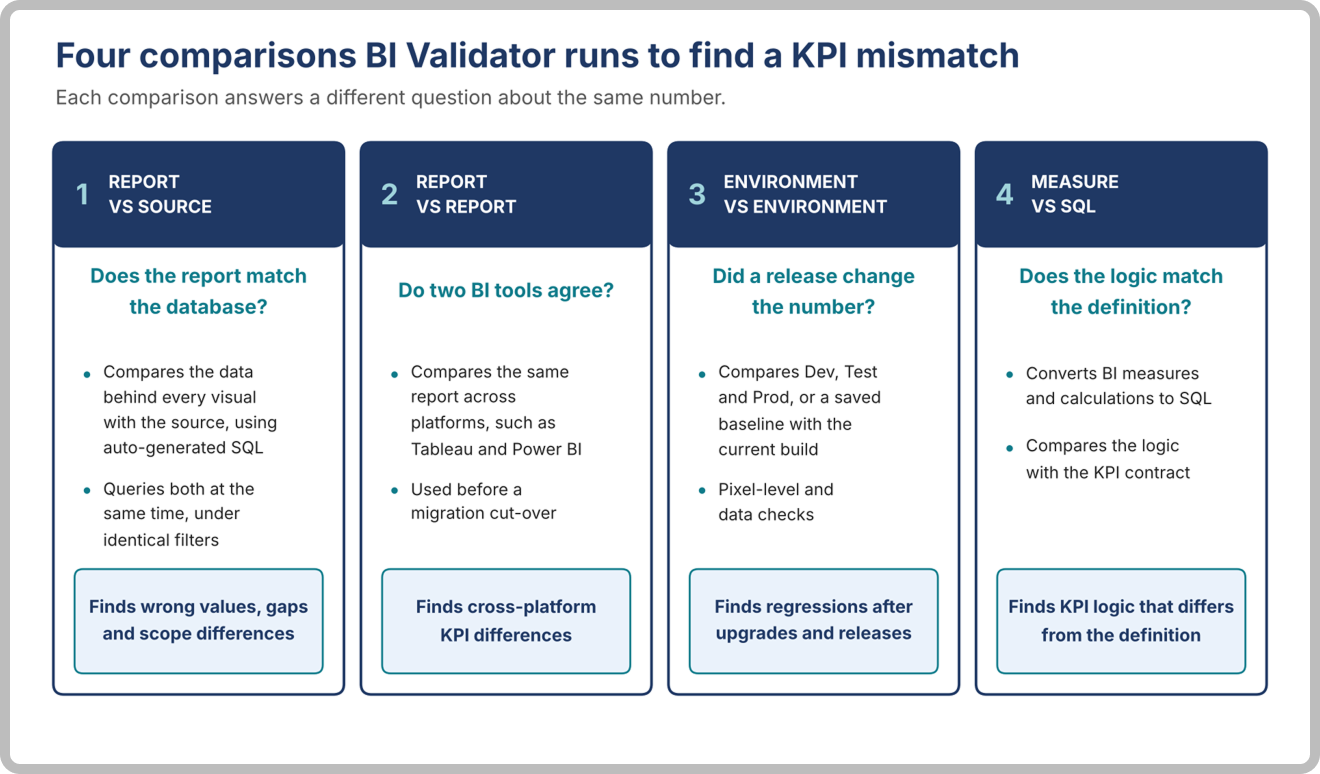
BI Validator Comparision
The four BI Validator comparisons for a KPI mismatch

How do you find and explain a KPI mismatch with BI Validator?

Six steps take a mismatch from first sighting to prevention.

Step 1: How do you define the KPI to test?

Write down the definition, owner, source of record, grain, filters, time rule and refresh time. These become the settings of the test, and the reference when a number differs.

Step 2: How do you connect BI Validator to your sources?

Connect BI Validator to the BI platform and to the source database, such as Snowflake, SQL Server, Oracle or Databricks. It needs no agent on the BI server.

Step 3: How do you build the comparison?

Describe the test in plain English and let the AI build it, or capture filter and parameter selections in the embedded browser. Bulk creation turns hundreds of filter combinations into test cases, which matters because most report errors appear only when filters are applied.

Step 4: How do you read the results?

BI Validator compares the data behind every visual with the source using auto-generated SQL, under identical filter conditions. The results show which visuals and filter states differ. For measures, measure logic checks convert the calculation to SQL, so the KPI logic can be compared with your definition.

Step 5: How do you explain the difference?

Split the gap by filter, date, region and source until every piece has one cause, as Figure 2 shows. BI Validator’s AI-driven root cause analysis suggests the cause and a fix, and its AI summary describes in plain language what changed between report versions. BI Analyzer and BI Catalog help find inconsistent measures and trace report lineage.

A variance bridge for one illustrative KPI mismatch.

If the difference starts upstream, ETL Validator and DataOps Data Quality, the other products in the DataOps Suite, test the pipeline. See data reconciliation.

Step 6: How do you keep the mismatch from returning?

Capture a baseline before each upgrade or release, then rerun and compare. Schedule runs with email alerts on failure, trigger test plans from Azure DevOps or GitLab through the CLI or REST API, and keep results in one repository for audit. The same tests check a Tableau to Power BI move, as the migration guide shows. Treat the rerun as release regression in the enterprise BI testing framework, and see Follow One KPI from Source to Dashboard for a single-path walkthrough.

What results do teams report?

ZS Associates standardized BI report validation with BI Validator and reports 70% time savings, 80% less turnaround time and full adherence to its UI validation standards. A Midwest insurer automated its NAIC MAR reconciliation with BI Validator and DataOps Data Quality, and its premium variance trace fell from multiple days to hours.

BI Validator also supports regulated reporting. It proves capital and board dashboards match the warehouse in banking and insurance, catches KPI changes after every refresh in healthcare clinical dashboards, and traces commercial and clinical KPIs to source records in life sciences. The ROI calculator models payback.

Conclusion: find the difference, then prove the cause

Define the KPI, compare it with its source, isolate the filter or measure that differs, and keep the evidence. BI Validator runs those comparisons across your sources, platforms and environments, helps explain what it finds, and reruns the same tests after every release.

Frequently Asked Questions

What is a KPI mismatch in BI reporting?

It is a case where the same KPI shows different values in two reports, or in a report and its source. Each mismatch has a cause: a different definition, timing, scope, a data quality issue or a logic error. See the BI testing guide.

How does BI Validator find a KPI mismatch between a report and its source?

It queries the BI platform and the underlying data source at the same time, under identical filter conditions, and compares every value. The comparison uses auto-generated SQL on sources such as Snowflake, SQL Server, Oracle and Databricks.

Can BI Validator compare the same KPI across Tableau and Power BI?

Yes. It validates that new Power BI reports match the equivalent Tableau reports, so you can test cross-platform consistency before you decommission the old reports. See Tableau testing and Power BI testing.

How does BI Validator explain why a KPI differs?

It applies filter combinations so you can see which filter state differs, converts measures to SQL so the logic can be checked, and uses AI to suggest a root cause and to summarize what changed between report versions in plain language.

Which BI platforms does BI Validator support?

Power BI, Tableau and Oracle Analytics are the core platforms, with support for Cognos, Amazon QuickSight and Microsoft Fabric as well, and no agent on the BI server. See Oracle Analytics testing.

Validate your Power BI measures against source data

Book a personalized 30-minute demo, or start a 14-day free trial.

Raj Mohan Achanta
RajMohan Achanta

Senior Associate Product Manager, Datagaps

Senior Associate Product Manager at Datagaps. Shapes the product experience across ETL Validator, BI Validator, and DataOps Data Quality.

Avinash's picture
Avinash Keshri

Head, Product Marketing

Head of Product Marketing at Datagaps and IIM Bangalore alumnus. 13+ years of experience in commercializing AI and data platforms across global markets.

Established in the year 2010 with the mission of building trust in enterprise data & reports. Datagaps provides software for ETL Data Automation, Data Synchronization, Data Quality, Data Transformation, Test Data Generation, & BI Test Automation. An innovative company focused on providing the highest customer satisfaction. We are passionate about data-driven test automation. Our flagship solutions, ETL Validator, DataFlow, and BI Validator are designed to help customers automate the testing of ETL, BI, Database, Data Lake, Flat File, & XML Data Sources. Our tools support Snowflake, Tableau, Amazon Redshift, Oracle Analytics, Salesforce, Microsoft Power BI, Azure Synapse, SAP BusinessObjects, IBM Cognos, etc., data warehousing projects, and BI platforms.  Datagaps

Related Posts:
×